Comparison between accidents and suicides in Canada
This section compares accidents and suicides. This comparison is important for prevention because if there frequent characteristics they may be used to suggest common prevention strategies. However, specificities for each could suggest specific targeted prevention strategies for each type of fatality.
|
Comparison Variables |
Accidents |
Suicides | Comments |
| Number of fatalities over 10 years | 460 | 428 |
Accidents are more frequent than suicides on the Canadian railway network |
| Annual variations and trends |
|
|
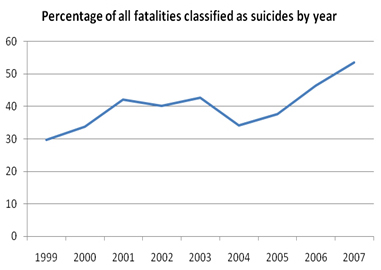
With the exception of 2005, accidents have remained relatively stable over the years. However, the suicide rate has increased over time, thus increasing the proportion of railway fatalities which are suicides. This data may indicate that accident prevention and safety campaign have a positive effect. |
| Weekly variations |
Accidents occur more often during the weekend and often occur in combination with alcohol use. |
Suicides do not have a weekly pattern |
|
| Ages |  |
 |
Middle aged adults (between 31 and 60) are more often involved in suicides and older adults are more often involved (>60) in accidents. |
| Gender | 4:1 | 4:1 |
The gender proportions of rail accidents and suicides are the same. However, railway fatalities are much more frequent for men. |
| Socioeconomic context |
12.8% were unemployed or unable to work 70% were in full time employment 36.6% lived with a spouse 9.1% lived with spouse and children 26.1% lived with their parents 13.6% lived alone 14.7% had no fixed long term accommodation 75.9% were in a relationship at time of death More men were single than women (23.7% versus 5.3%) |
43.3% were unemployed or unable to work 26.6% lived with a spouse 12.7% lived with spouse and children 23.1% lived with their parents 17.9% lived alone 19.6% had no fixed long term accommodation 45.9% were in a relationship at the time of death, with more of this figure accounting for women than men (64% versus 58.8%) |
The average unemployment rate in Canada over the same period was about 7%. Accident and suicide victims are more likely to live in a poorer economic context. Suicide victims do not generally seem to be isolated. |
| Health |
19.4% had a chronic physical health problem Mental health problems were rare among accident victims 18% had a problem with substance abuse |
13% had a chronic physical health problem A majority of suicide victims had mental health problems 30% had a problem with substance abuse |
|
| Behaviour prior to death |
72% had used substances prior to death |
45.8% had used substances prior to death |
|
| Behaviour on tracks |
Driving across the tracks (97) Walking or running across the tracks (45) Did not move when train whistled (33) Walking on track facing away from train (32) Facing away from train (32) Lying on tracks (26) Standing or sitting on tracks (21) Tried to get out of the way (13) Ran suddenly in front of the train (12) Sleeping on tracks (12) Went around barriers (11) Wearing a hoody or walkman (11) Walking along the tracks (11) Made contact with the side of train (10) |
Ran out suddenly in front of the train (99) Lying on the tracks (80) Standing or sitting on tracks (79) Facing the train (57) Did not move when train whistles (53) Head on rail (40) Facing away from train (35) Looking at the driver / train engine (33) Placing arms out (22) Walking along tracks (19) Walking on tracks facing train (14) Driving across tracks (10) Gesturing towards crew (10) |
This information should be read with the understanding that the information gathered may be biased and may not represent all the behaviours that occurred as it was taken from the written statements of crew members to the police at the time of the incident. |
| Use of vehicles |
43.8% of accidents involved a vehicle |
5.6% of suicides involved a vehicle |
|
| Location |
|
|
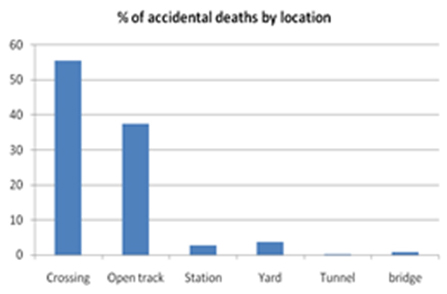
The distance between place of residence and place of death differs for accidents and suicides. Suicide victims tend to die closer to their home. This supports the hypothesis that the choice of a suicide method depends greatly on familiarity and availability. Suicides occur more often on open tracks and accidents more often at crossings. The proportion of suicides and accidents varies by province, with Alberta and Saskatchewan having the largest proportion of accidents and British Columbia, Ontario, and Québec having the highest proportion of suicides. |